Like any stock index, from time to time the S&P 500 index seems to hand pick a number and make it an important support and resistance level. Sometimes these lines in the sand are ephemeral and sometimes they persist for extended periods.
Take SPX 1070, for instance. Back in October 2009, SPX 1070 was the exact midpoint in the SPX trading range I talked about in Strangle Pong and two subsequent posts (see links below.)
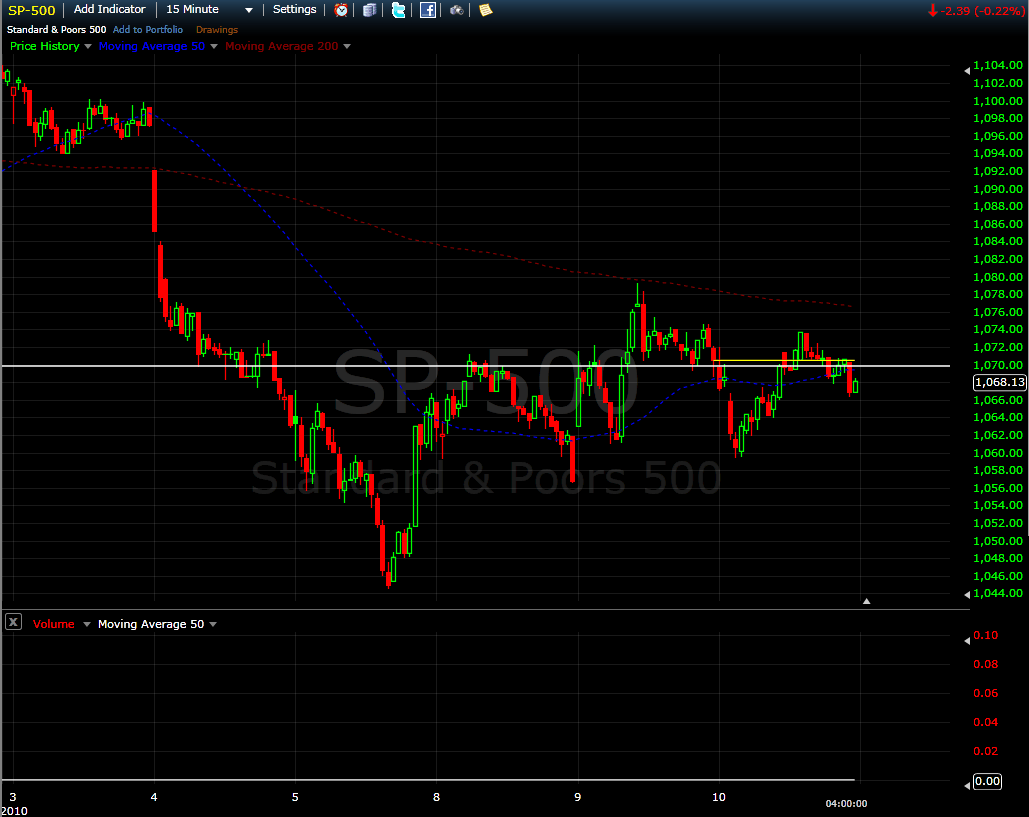
Since last Thursday, it seems as if SPX 1070 is starting to reassert itself once again. In the chart below, 1070 acts as critical support for awhile on February 4th, then as resistance on the 8th. Yesterday and today, 1070 was a pivot point of sorts, acting as both support and resistance. With 1070 just above today’s close and the futures currently pointing to a bullish start to tomorrow’s session, I will be watching closely to see how the SPX acts while crossing above or below the 1070 level.
For posts on the Strangle Pong and related subjects, readers are encouraged to check out:
Disclosures: neutral position in SPX via options at time or writing
[source: FreeStockCharts.com]