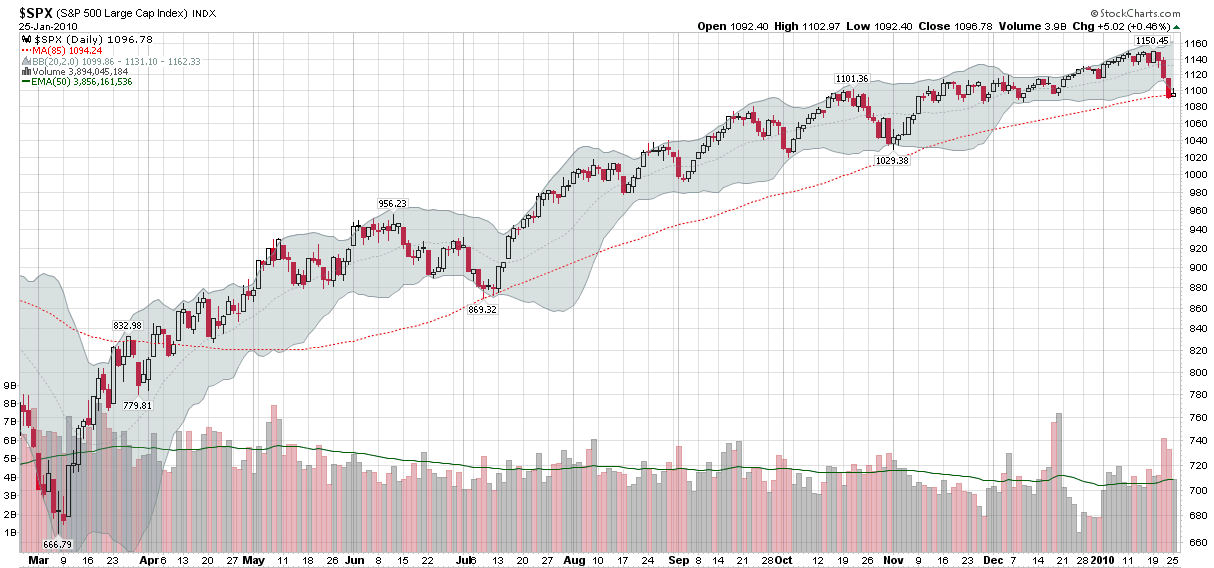
In the beginning of November, in Chart of the Week: Reverse Engineering a Critical Moving Average, I talked about the importance of being able to “develop customized moving averages that circumscribe past price action in order to get a better understanding of how current forces acting on stock prices compare to past forces.”
After looking at various ways to optimize moving averages that were critical support levels (at least retrospectively), I arrived at an 85 day moving average for the S&P 500 index as an excellent approximation of support during the March-October 2009 period.
Fast forward to January 2010 and the current pullback has just managed to dip below the 85 day MA on Friday and close above that level today. For now at least, an 85 day moving average is about as good a measure of support as one can find on the charts. In my next post, I will detail what I believe is a meaningful enhancement to the moving average approach.
For more on related subjects, readers are encouraged to check out:

[source: StockCharts]
Disclosure: none