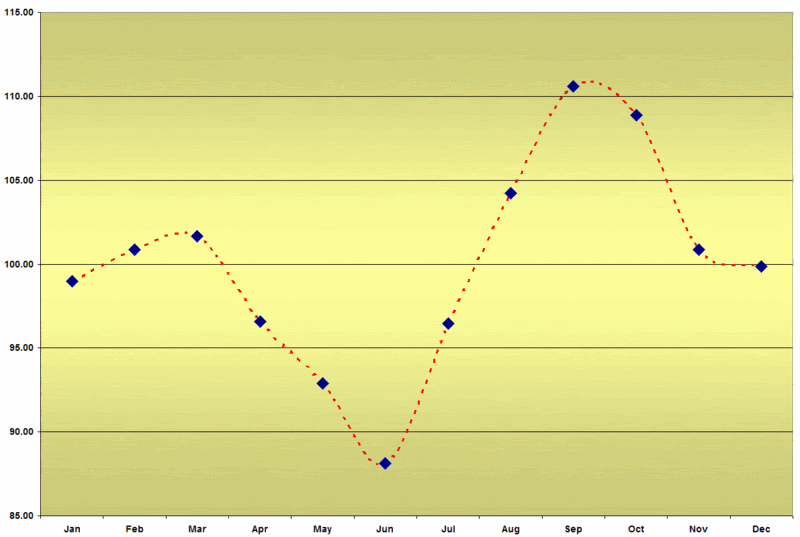
I’ll cut to the chase and put the graph of the monthly closes (with all values normalized to a monthly mean of 100) in the VIX first:
Since the picture tells almost the whole story, I’ll add only a few supplemental comments:
- We are currently in the middle of the November-March doldrums
- March-June and June-September are the two monthly volatility trends to keep an eye on
- From a “sell in May and go away” perspective, the May-August period has included the VIX high month only twice, but the low VIX month ten out of seventeen years
Bill , quite an interesting data. I shall now see how to cash this in the options market :)
ReplyDeleteCheers,
OptionPundit
Bill, Thanks for the analysis. I took the liberty to quote in my blog posting about hedge fund December performance spikes.
ReplyDeletehttp://thedealsleuth.wordpress.com/2008/01/05/hedge-fund-december-performance-spike-can-be-explained/
Regards, Thomas
Thanks for working some of my research into a particularly thought provoking post, Thomas.
ReplyDeleteCheers,
-Bill