Monday, May 31, 2010

Chart of the Week: SPX, Fibs and 200 Day MA

This week’s chart of the week is an attempt to offer something relatively simple and uncluttered: a one year look at the S&P 500 index.

The chart below shows daily bars of the SPX, with four highlighted overlays:

  1. A 200 day moving average (dotted green line) – currently at 1105, moving up about two points a week and looming as possible upside resistance

  2. Fibonacci retracement levels drawn from the July 2009 low of 869 to the April 2010 high of 1219 – these generate a 50% retracement level of 1044 (recent support) and a 38.2% retracement level of 1085 (just below current levels)

  3. Volume, including a 50 day moving average (solid green line) – which shows activity picking up dramatically in May

  4. Bollinger bands (the gray cloud, based on 20 days and 2 standard deviations)

Apart from noting that the 200 day MA and Fibonacci retracement levels (particularly 1085 at the moment) look to be important lines in the sand, I will leave the balance of the conclusions to the reader.


[source: StockCharts.com]

Disclosure(s): none

Friday, May 28, 2010

CBOE Launches Options on VXX and VXZ

The iPath S&P 500 VIX Short-Term Futures ETN (VXX) has been one of the most closely followed topics on VIX and More, ever since the day the two VIX ETNs were launched, in January 2009. In the intervening 16 months, VXX has gone from an obscure niche product to a favorite of day traders, with volumes in excess of 20 million in each of the last 18 sessions. As a result, it is with great excitement that I note the CBOE has begun to offer options on VXX and VXZ today. (hat tip, Adam Warner)

I have discussed the calculation and performance quirks relative to VXX and its sibling, the iPath S&P 500 VIX Mid-Term Futures (5 month) ETN (VXZ) at considerable length in this space in the past and will not dive into that subjects again today. For those who are interested in exploring these issues in greater detail, the links below are a good place to start, as are the tags and hyperlinks for items such as VXX, term structure, VIX futures, contango and negative roll yield.

An even more through discussion of VXX calculations and performance can be found in The VIX ETNs: VXX and VXZ, in the March 2010 issue of Expiring Monthly.

I think it is safe to say that VXX options will open up a whole new world of volatility trading opportunities, whether considered separately or in conjunction with VIX options and other volatility products. I will definitely devote a good deal of time to this subject going forward.

For more on related subjects, readers are encouraged to check out:


[source: StockCharts.com]

Disclosure(s): short VXX at time of writing; I am one of the founders and owners of Expiring Monthly

Thursday, May 27, 2010

The VIX, Rule of 16 and Realized Volatility

Two days ago, in Rule of 16 and VIX of 40, I discussed the Rule of 16 in terms of translating the (annualized) VIX number into expectations for future daily realized volatility in the S&P 500 index.

That post drew several interesting comments, which unfortunately they now reside somewhere in Disqus limbo. In one of the comments, rafaminos offered the following thoughts:

It seems that VIX is on average higher that realized volatility (based on daily returns over 30 days). I also tried to shift VIX 30 days in advance and the conclusion is the same. Since the historical ratio of the two is 1.45 (VIX/realized volatility), should not we infer from this past relationship that the implied realized volatility is more like 30 (45/1.45), meaning a 2% change 1/3 of the time?

My reply appears to be somewhere in comment purgatory as well, but the essence of my response is as follows:

Over that last 20 years, I get a VIX that is about 1.40 times the SPX 20-day realized volatility. I attribute some of the discrepancy to the high demand for SPX puts as hedges, which tends to inflate the VIX relative to realized volatility (and immediately suggests some strategic implications vis-a-vis short SPX puts strategies.)

So...given that a VIX of 32 is about 1.4x SPX realized volatility and 32/1.4 = 22.9 and 32*1.4 = 44.8, based on the historical evidence, I would conclude that:

1) VIX of 32 – 1/3 of the time the SPX is expected to have a daily change of at least 2%, but...

2a) VIX of 32 – 1/3 of the time the SPX will (based on historical data) have a daily change of at least 1.4%
2b) VIX of 45 – 1/3 of the time the SPX will (based on historical data) have a daily change of at least 2%

For more on related subjects, readers are encouraged to check out:

Disclosure(s): short VIX at time of writing

Wednesday, May 26, 2010

Expiring Monthly May Issue Recap

Just a quick note to confirm that on Monday marked the publication of the May issue of Expiring Monthly: The Option Traders Journal.

I have attached a copy of the Table of Contents for the May issue below. The cover story for this issue was written by Mark Wolfinger and focuses on the CBOE benchmark indices for buy-write (covered call) put-write and collar strategies. In my opinion, these three options strategies are attractive ways for investors who seek to outperform the broad-based indices in declining, sideways and slightly bullish markets – which is not a bad description of the market activity we have been seeing lately. In the case of collars, one can also have complete protection against market crashes and fund this approach entirely by selling calls.

For the current issue, I contributed a feature article on ETFs and micro benchmarking (the art of finding a very narrow slice of the investment universe as an appropriate gauge of portfolio performance) as well as my recurring column, Charting the Market, which makes heavy use of options data. In addition to the introductory Editor’s Note, I also penned the Back Page commentary, which puts my personal slant on the process of educating a trader.

Additional details about the magazine are available at http://www.expiringmonthly.com/.

Note that next week I will be inviting reader submissions for the Chart of the Week and will award an annual subscription to my favorite submission.

For more on related subjects, readers are encouraged to check out:


[source: Expiring Monthly]

Disclosure(s): I am one of the founders and owners of Expiring Monthly

Tuesday, May 25, 2010

Rule of 16 and VIX of 40

After a year or so of almost uninterrupted falling volatility, the last few weeks have seen a surge in the VIX and other measures of volatility. In fact the VIX more than tripled in a little over a month, jumping from an April 12 low of 15.23 to a May 21 high of 48.20.

One way to come to terms with the current 40ish level in the VIX is to think in terms of daily percentage changes in the underlying, the S&P 500 index. Technically, the VIX represents one standard deviation of the market’s estimation of changes in the price of the SPX during the next 30 days. The VIX number is the size of that standard deviation in annual percentage terms, but since volatility is a function of the square root of time, in order to translate that annual standard deviation number into a daily number, one has to divide by the square root of the number of trading days in a year. A year typically has about 252 trading days and the square root of 252 is 15.87, which options traders generally round up to 16 in their head. Hence the “Rule of 16.”

Using 16 makes it easy to do some quick math in one’s head. If the VIX is at 16, as it was a little over a month ago, one would expect that 68.2% of the time (one standard deviation), the daily change in the SPX would be 1% or less and 31.8% of the time it would be 1% or more. To simplify the math even more, options traders often make the mental conversion of 68.2% to two thirds. Since traders are generally more concerned about big moves than small ones, they tend to focus on the outlier portion of the standard deviation calculation, the one third of trading days which are more volatile than normal.

Using the rule of 16 and the 1/3 trading days time frame, the following translations should be committed to memory:

  • VIX of 16 – 1/3 of the time the SPX will have a daily change of at least 1%
  • VIX of 32 – 1/3 of the time the SPX will have a daily change of at least 2%
  • VIX of 48 – 1/3 of the time the SPX will have a daily change of at least 3%

Simple math allows us to do a linear interpolation. Today, with the VIX hovering around 40, options traders are expecting that the SPX will have daily change of 2.5% about 1/3 of the time.

Looking backward, as volatile as the market have been recently, only three days out of the past month have resulted in daily changes of 2.5% or more. In fact, for all of 2010, there have been only four days in which the SPX has been either up or down at least 2.5%.

In terms of conclusions, either market volatility is about to increase substantially from current levels or options traders have overestimated future volatility. As bearish as today has been, the SPX is “only” down 1.6% as I type this. If we have one or two more days in which stocks show average to slightly higher than usual volatility, expect the VIX to begin to move back down to a level that is a better reflection of those daily moves.

For more on related subjects, readers are encouraged to check out:

Disclosure(s): short VIX at time of writing

Sunday, May 23, 2010

Chart of the Week: The Flight-to-Safety Trade

This week’s chart of the week looks at some of the various flight-to-safety trades that investors have been taking advantage of since the recent closing high of 1217 in the S&P 500 index from April 23rd.

In the chart below, note that first gold (GLD) and then the dollar (UUP) peaked as hedges against stock declines. More recently, U.S. Treasuries have been the favored flight-to-safety vehicle, with the long bond ETF (TLT) outperforming the other two alternatives and shorter-term Treasury ETFs such as IEF, not shown, attracting quite a few buyers.

Also not shown in the chart below is VXX (iPath S&P 500 VIX Short-Term Futures ETN), which is more of a hedge than a flight-to-safety alternative. During the last month VXX is up 81.3%, with a volatility level of 113.6.


[source: ETFreplay.com]

Disclosure(s): short VXX at time of writing

Thursday, May 20, 2010

Guest Columnist for Steven Sears at Barron’s

Steven Sears at Barron’s has once again been kind enough to give me an opportunity to author a guest column for The Striking Price while he is on assignment.

With the VIX in the 40’s this week, I elected to write about how difficult it is to forecast volatility. In The Perils of Predicting Volatility, I talk about how the VIX typically underestimates large volatility spikes and overestimates the extent to which volatility will remain high following a VIX spike.

The Barron’s article integrates many of the ideas I have been blogging about for the past few years, some of which are included in the links below.

For those who may be interested, the last time I contributed to Barron’s was with Take a Longer View on Volatility – a subject that I think is quite timely today, given the recent volatility surge.

For more on related subjects, readers are encouraged to check out:

Disclosure(s): short VIX at time of writing

VIX Approaches Pre-2008 Record Highs

Prior to 2008, the VIX had only managed to nudge its way over 45 on three instances:

  1. The 1998 Long-Term Capital Management crisis
  2. The Russian Financial Crisis that preceded the LTCM debacle
  3. The height of the dotcom crash, when WorldCom filed for bankruptcy

The table below summarizes the top ten pre-2008 VIX closing highs. Should it hold, today’s VIX spike to 45.21 would put it at #3 all-time outside of the 2008 financial crisis.


Disclosure(s):
short VIX at time of writing

Tuesday, May 18, 2010

Volatility and Wide-Range Days with Neutral Closes

A reader notes:

The VIX tends to move inversely with the market on a day-to-day basis. Market up = VIX down and market down = VIX up. That’s all fine and dandy MOST of the time (I’m stating the obvious here) because of expectations about the asymmetry of volatility during bull versus bear moves. But how do we square moves like Monday (05/17) when, even though the close-to-close change in the market was very small, the intraday move was very large (with implications re: continued high volatility), yet the VIX still fell? Does the VIX (from a statistical correlation perspective) only care about close-to-close changes? Isn’t that a bit shallow?
This is an excellent comment and set of questions.
In terms of background, consider that measures of volatility based on actual changes in the price of the underlying break out into two camps:
  1. those that focus on close-to-close price changes and ignore/understate intraday price movements (e.g., historical volatility)

  2. those that include intraday price variations in their calculations (e.g., average true range)
Here is where an example might help to clarify things. Take the recent ‘flash crash’ of May 6
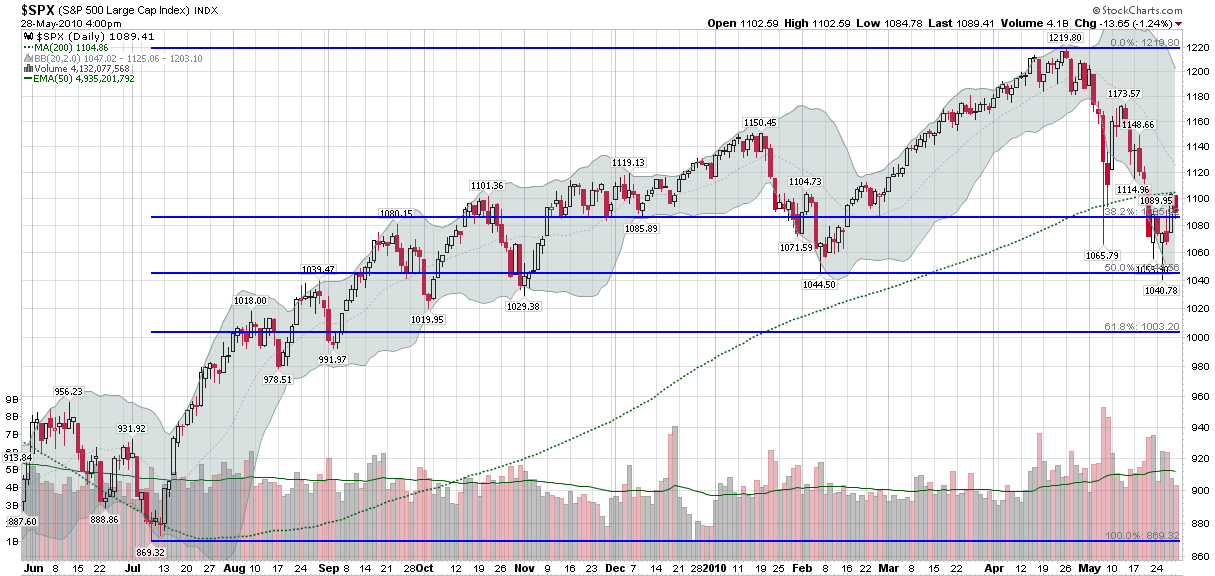
th. Even though the close-to-close change in the S&P 500 index (SPX) was a very large 3.24%, the intraday range was a whopping 8.73%. So which was the better measure of volatility on that day? My guess is that anyone who was watching the markets as they crashed would vote for the 8.73% move, as things certainly felt more like the panic of October 2008 than the relative calm of October 2007.

Given that implied volatility values such as the VIX are calculated directly from options prices, in theory the VIX does not strictly account for intraday prices. Also, technically the VIX is the market's forward estimate of close-to-close volatility in the SPX. So from a pure statistical perspective, the VIX does indeed have a narrow close-to-close time horizon and is blind to intraday fluctuations in prices.

In practice, however, a wide range day with a relatively benign close-to-close number will typically reinforce the idea that the market is ripe for large volatility moves, even if these moves may cancel each other out on intraday basis. In my opinion, mapping these changes in price to changes in volatility is where fundamental factors and path dependency come into play. If stocks go up 3% intraday, for example, then fall back to even due to news that, say, the government had to prop up a U.K. bank, Spain has announced it will not implement austerity measures, a Fed member makes a speech in which he or she suggests interest rate hikes are coming soon, there is a terrorist attack in Israel, etc., you would expect to see the VIX price in more volatility in the next 30 days. On the other hand, if stocks start the day down 3%, but closed even following news that lots of jobs were created, housing prices are increasing, the euro rallied to 1.30, etc., then I would expect the VIX to price in less volatility in the next 30 days.

In brief, on a wide range day, I would look hard at the fundamentals or what I call the Forces Acting on the VIX, as well as perhaps the elements of volatility I summarized in A Conceptual Framework for Volatility Events. If news suggests that an obvious threat to the market has been eliminated or diminished significantly, then I would expect the VIX to fall, depending upon the applicability of the dragon metaphor. If a new threat crops up or an old one suddenly seems more robust, then I would expect to see a rising VIX.

Even when stocks seem to turn the corner and put a threat behind it, there is often some sort of psychological hangover that behavioral economists would probably call “availability bias” and I have termed “disaster imprinting.” This is the type of thing that happens on a wide range day that ends with a neutral close. So while the VIX is really estimating what historical close-to-close volatility will be 30 days hence, the presence of wide intraday moves almost necessarily forces options traders to consider increasing their estimates of the probability and/or magnitude of large market moves going forward.
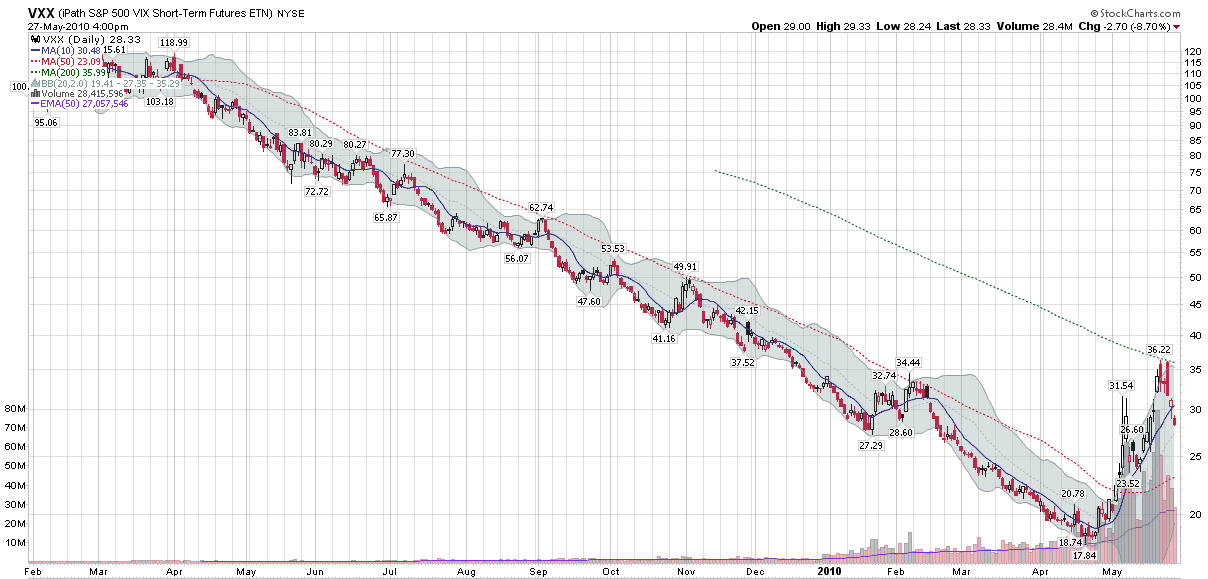
Finally, getting back to your question about last weekend, part of what happened was that on Friday skittish investors bought so much portfolio insurance that the VIX priced in the possibility of a very large volatility event. When Monday's reality fell short of Friday's worst fears, the VIX began to fall.

For more on related subjects, readers are encouraged to check out:
Disclosure(s): short VIX at time of writing

Sunday, May 16, 2010

Chart of the Week: VSTOXX, VIX and the Risk of Global Contagion

Several weeks ago, The New York Time ran an excellent graphic showing the interconnectedness of European debt in Europe’s Web of Debt. Other sources periodically trot out various charts of credit default swaps (CDS), but I have yet to see a graphic which attempts to measure the risk of global contagion.

This week’s chart of the week is an attempt to reduce a hypothesis about global contagion to a simple ratio chart. The hypothesis is that whereas the VIX is the best measure of uncertainty in the U.S. stock market and the VSTOXX (which is based on the EURO STOXX 50) is the best measure of uncertainty for euro zone stocks, the ratio of the VSTOXX to the VIX should capture the relative uncertainty for euro zone stocks vs. U.S. stocks. One would expect, therefore, that if VSTOXX is rising faster than the VIX, that options traders are expecting much higher uncertainty (and downside risk) in the euro zone than in the United States. This type of action would support a decoupling theory in which stock markets in the euro zone and the U.S. would begin to move independently of each other. On the other hand, should the VIX be rising at the same rate as VSTOXX, this would suggest that uncertainty and risk are roughly the same in the euro zone and the U.S. and that the risk of global contagion is relatively high.

The chart below is a weekly chart of VSTOXX and the VIX going back to November 2007, just after stocks peaked. Looking at the ratio during the past 2 ½ years, it shows that VSTOXX peaked relative to the VIX three weeks ago, pulled back dramatically up to last week, then surged up through Friday, where the ratio had its second highest weekly close. The verdict from the ratio seems to be that the risk of global contagion is high, slightly below the all-time high, but on the rise.

I will have more about the VSTOXX:VIX ratio going forward.

For more on related subjects, readers are encouraged to check out:


[source: STOXX, CBOE]

Disclosure(s): short VIX at time of writing

Thursday, May 13, 2010

Brett Steenbarger’s TraderFeed Archives

In the four years or so I have been using blogs as one of my core investment resources, only a handful of these blogs have consistently offered up high quality information and analysis. At the top of that list is probably Dr. Brett Steenbarger’s TraderFeed, which has specialized in trader psychology, where it has been the destination blog for this subject since its launch. Unfortunately, TraderFeed will no longer see any new posts, as Dr. Brett has made a career change which has resulted in the a cessation of new material on the blog. Fortunately, however, TraderFeed will live on as an archive of some 3700+ posts.

As far as I am concerned, what set TraderFeed apart was the interweaving of psychology, market sentiment, technical analysis and related subjects, deftly researched and written, all tied together with a fountain of original ideas. Back in the days when I used to periodically assemble my linkfest posts, it seemed almost impossible to cherry pick from the best of the blogosphere without including at least one post from Dr. Brett, as the links below can attest to.

The archives notwithstanding, the end of TraderFeed leaves a large hole in the blogging world. I have enjoyed others who have written extensively on trader psychology, including Denise Shull at Trader Psyches, but the departure of TraderFeed also provides me with an excuse to work more of my thinking about trader psychology into this blog. So whereas I still have many thousands of posts on the VIX and volatility kicking around in my head, I will also consider this development as an opportunity to explore some of the “…and More” side of this blog.

Finally, as luck would have it, Expiring Monthly had a feature interview with Brett Steenbarger just before the decision was made to put TraderFeed on hold. Look for Mark Wolfinger's conversation with Brett in the May edition of Expiring Monthly, which will be published on the Monday following the current options expiration cycle, May 24.

For more on related subjects, readers are encouraged to check out:

Disclosure(s): I am one of the founders and owners of Expiring Monthly

Tuesday, May 11, 2010

Recent Performance Divergence in European ETFs

With all the turmoil in Europe, I thought it would be interesting to check on some of the single country ETFs for those nations which have been closest to the sovereign debt crisis. The chart below, courtesy of ETFreplay.com, captures the year-to-date price movements and (historical) volatility for the likes of Germany, France, Italy and Spain.

Not surprisingly, Germany has held up the best and Spain has been the worst performer in 2010. France, which had been tracking fairly close to Germany, has fallen into second as the country’s bank exposure to Greece has saddled France with additional risk. Italy, which has been on the periphery of the contagion concerns, has fared only slightly better than Spain and has actually been the worst performer of the four during the last month and a half as the crisis has deepened.

Also, note that as is often the case, volatility is negatively correlated with performance in these countries, as the largest moves have been negative ones.

For more on related subjects, readers are encouraged to check out:


[source: ETFreplay.com]

Disclosure(s): long EWG at time of writing

Monday, May 10, 2010

New Record for One Day Fall in the VIX

The VIX spikes up, but it rarely spikes down, today’s action notwithstanding. In fact, today’s 29.6% decline in the VIX is the largest single day decline in the 17 year history of the VIX and in the 20 years of reconstructed VIX data.

Using reconstructed data for VXO, which utilizes the original calculation methodology for the VIX, I find only one instance in the last 24 years in which the VIX declined more than it did today: Wednesday, October 21, 1987, two days after Black Monday, when the (original calculation) VIX fell 47% from 140 to just under 74. [For background information, try VXO Chart from 1987-1988 and Explanation of VIX vs. VXO for more information on VXO]

In thinking about the relative abundance of VIX spikes and scarcity of dramatic VIX drops over the course of history, I sometimes like to invoke the metaphor of a medieval castle. A dragon periodically appears and terrorizes the castle and its inhabitants, sometimes visible for only a fleeting moment and other times hanging around for an uncomfortably long period of time. Every time the dragon appears, the citizens panic. One day a knight goes out into the forest and slays the dragon, returning with the head of the beast. The citizens rejoice and relax for a moment, until it occurs to them that the forest may be filled with dozens of dragons.

So…one dead dragon does not mean the crisis has passed.

Getting back to statistics, the VIX has fallen 20% in one day on eight previous instances. On average, looking forward one day, week, month, quarter, etc., stocks have tended to underperform somewhat following a sharp drop in the VIX. The last two instances of 20% drops, from October 2008, have now skewed the data so that aggregate performance looks quite dreadful. Still, one can argue that in the first three of the eight instances (1993, 1994 and 2006), stocks outperformed historical averages when looking at least two months out. All things considered, small sample size and all, I would have to conclude that today’s action translates to a mildly bearish outlook going forward – at least based on historical data.

For more on related subjects, readers are encouraged to check out:

Disclosure(s): short VIX at time of writing

Sunday, May 9, 2010

Chart of the Week: The Weekly VIX

There were so many fascinating developments in the financial markets during the week, that it is difficult to single one chart out as this week’s chart of the week. As this blog has the VIX in the title, however, it seems sacrilegious to potentially overlook the fact that the VIX spiked more last week than in the entire history of the VIX, even including reconstructed VIX data going back to the beginning of 1990. The 85.7% jump in the VIX last week easily surpassed the previous record of 75.9%, which was from the week of February 27, 2007, when the Shanghai Stock Exchange composite index fell 8.8% in one day.

The chart below captures weekly bars of the VIX going back to the beginning of 2006. The chart highlights the fact that most VIX spikes are a 2-3 week phenomenon. As I see it, the record VIX spike of September-November 2008 is the type of extended VIX spike one only expects to encounter every two or three generations.

The difficulty in dismissing the current crisis is that as volatility has a tendency to cluster, so do financial crises. For example, the Asian financial crisis of 1997 helped to sow the seeds for the Russian financial crisis and Long-Term Capital Management crisis of 1998. Several years later, the 2000-2002 bear market in technology stocks – and the government response – helped to sow the seeds for the housing bubble that began as the 2007 subprime mortgage crisis and eventually blossomed into the 2008 financial crisis. The current European sovereign debt crisis certainly has many of its roots in the crises of 2007 and 2008.

So while I do not expect the VIX to remain over 40 in the days and weeks ahead, I am aware that the current crisis will leave deep economic and pschological scars on the landscape that will take months and years to heal in full. More importantly, the governmental response to the current European sovereign debt crisis could easily extend the cycle of current volatility or send ripples through history that will amplify the effects of future financial crises.

When it comes to the VIX and volatility, watching history in the making is typically gut wrenching and expensive, with very few spectators able to enjoy the entertainment value of new records.

For more on related subjects, readers are encouraged to check out:


[source: StockCharts.com]

Disclosure(s): short VIX at time of writing

Friday, May 7, 2010

VIX Implied Volatility Exceeds 2008 Crisis Levels

VIX options are attracting so much attention that the implied volatility of the VIX is currently at 133, which exceeds that high of 126 that was hit during the 2008 crisis. The obvious play here is to sell VIX calls, with short call spreads (bear call spreads) one way to limit risk.

For more on related subjects, readers are encouraged to check out:


[source: Livevol Pro]

Disclosure(s): short VIX at time of writing; ivevol is an advertiser on VIX and More

Thursday, May 6, 2010

Some Thoughts on the Seis de Mayo Mini-Crash

There are a lot of excellent charts and commentary out there, but before I called it a night, I thought I would share a couple of thoughts about today’s action and the market’s prospects for tomorrow and beyond.
So…in no particular order:

  • The possibility of a fat finger order entry error cannot be dismissed, but even if there were one or more unintentional large trades, this does not nullify the concerns about sovereign debt contagion, breaking of technical support, recent excessive bullish sentiment, etc.
  • The bottom line is that stocks still have serious problems of a fundamental and technical nature.
  • Today’s correction would not have been so steep if stocks had not rallied so sharply, with only brief interruptions, for the past 14 months.
  • The VIX spiked over 40 today. While there is no magic number that signals a VIX top, the volatility index is up more than 110% in the last 18 trading days. Apart from September-October 2008, this has never happened in the 17 years since the VIX was launched.
  • Whether tomorrow morning opens up or down, I would not give much credence to any big moves at the open tomorrow. If I trade at all in the first half hour, I expect I will be fading any big moves.
  • Looking next week and beyond, I would not be surprised to see stocks enter into a trading range, with the late April highs as a top and today’s lows as a bottom.
  • Traders should keep in mind that watching and waiting for more market clarity is an appropriate strategy at times. Patience and discipline almost always trump trying to make something happen.
  • In times of increased uncertainty, I try to focus on preserving capital, evaluating the fundamental causes and likely duration of high uncertainty, targeting only high reward-risk opportunities, scaling in to new positions, and adhering to stringent stop loss and position management guidelines.
  • Finally, a personal motto is, “In volatility, there is opportunity!”
For more on related subjects, readers are encouraged to check out:


Disclosure(s): short VIX at time of writing

S&P 500 Index Correction at Post-March ’09 Average of 5.6%

A few minutes ago the S&P 500 index made an intraday low of 1151.49. While it remains to be seen whether this line in the sand will hold, it is important to note that the SPX is now 68.35 points below the high water mark of 1219.80 from April 26th. This means the index has corrected 5.6%, which is exactly the average (mean) pullback over the course of the past 14 months

The table below summarizes the 12 most significant pullbacks since stocks bottomed in March 2009. In percentage terms, the current pullback ranks 5th out of 12. Note that the pullbacks ranked fifth through eighth are all clustered around the 5.6% average.

Ultimately, the significance of a 5.6% pullback pales in comparison to fundamental issues surrounding Greece, Portugal and Spain (where the investors should pay the most attention), but given that 1150 also happens to be the high that preceded the January-February 9.2% pullback, the largest pullback since the bull market began, support in the area of 1150 to 1151 should be taken very seriously.


Disclosure(s):
none

Wednesday, May 5, 2010

VIX Tops are Notoriously Difficult to Call

...but I think 27.23 has a good chance of holding as a top.

Of course, events in Europe will ultimately determine where the VIX goes from here, but this does look like a good time to get short volatility.

Monday, May 3, 2010

Chart of the Week: VXX vs. VIX

Given that I have been banging the drum about VXX (iPath S&P 500 VIX Short-Term Futures ETN) since the day it was launched, now that volatility is showing some signs of coming back to life and VXX regularly trades 10-20 million shares per day, I thought it would be appropriate to provide a comparison of the performance of VXX and VIX.

For anyone who has been following this space, the substance of this week’s chart of the week should come as no surprise. Sure, volatility has been falling with almost unprecedented regularity over the course of the last 14 months, but VXX has been falling at a much faster rate than the VIX. In the last year, VXX has fallen at about twice the rate of the VIX, with the difference between the two accelerating over the course of the last 6-9 months.

As has been noted on a number of instances here, the main culprits responsible for the underperformance of VXX are the term structure of VIX futures, contango and negative roll yield.

For those who wish to get a quick overview of some of the issues behind VXX calculations and performance, Why the VXX is Not a Good Short-Term or Long-Term Play is a good place to start, with VXX Calculations, VIX Futures and Time Decay offering a more detailed explanation of what is driving the gap in performance between VXX and the VIX. An even more thorough discussion of VXX can be found in The VIX ETNs: VXX and VXZ, in the March 2010 issue of Expiring Monthly.

For more on related subjects, readers are encouraged to check out:


[source: StockCharts.com]

Disclosure(s): short VXX at time of writing; I am one of the founders and owners of Expiring Monthly

DISCLAIMER: "VIX®" is a trademark of Chicago Board Options Exchange, Incorporated. Chicago Board Options Exchange, Incorporated is not affiliated with this website or this website's owner's or operators. CBOE assumes no responsibility for the accuracy or completeness or any other aspect of any content posted on this website by its operator or any third party. All content on this site is provided for informational and entertainment purposes only and is not intended as advice to buy or sell any securities. Stocks are difficult to trade; options are even harder. When it comes to VIX derivatives, don't fall into the trap of thinking that just because you can ride a horse, you can ride an alligator. Please do your own homework and accept full responsibility for any investment decisions you make. No content on this site can be used for commercial purposes without the prior written permission of the author. Copyright © 2007-2023 Bill Luby. All rights reserved.
 
Web Analytics