Thursday, April 29, 2010

VIX Unspikes as Stocks Rebound

How many days does it take to undo a 30% spike in the VIX? This time around, the VIX retraced 82% of Tuesday’s 30.6% VIX spike in just two days, a bigger reversal than I had anticipated. By comparison, the S&P 500 index reclaimed slightly less ground, recovering 73% of the 38.18 point loss.

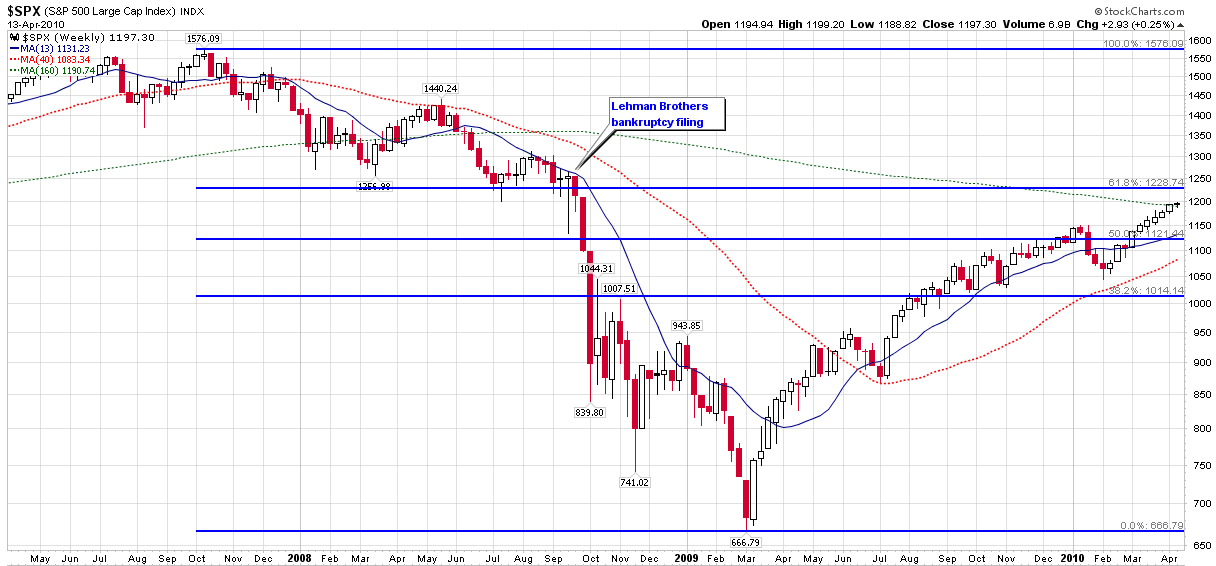
The chart below details the most significant pullbacks since stocks bottomed in March 2009, with this week’s 3.1% drop being the 10th largest in 13 months and considerably below the average drop of 5.4% during the period. Note that a 5.4% pullback from a high of SPX 1219 would put that index back at 1153, which is very close to January’s high of 1150.

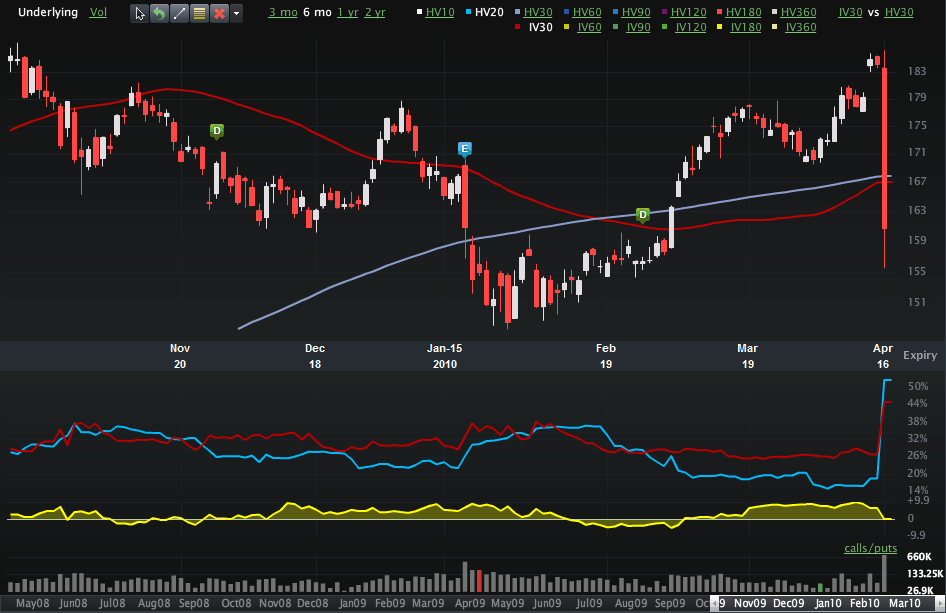
I have fielded quite a few questions on VIX options, VIX futures and VXX this week, many by readers who wish to know why these securities have been relatively placid compared to the seemingly more dynamic cash/spot VIX. The reason these securities have not retraced as much of Tuesday’s spike as the VIX is because while VIX May futures rose 2.3 points on Tuesday, they have only fallen 1.4 points or 61% in the past two days, largely due to the fact that mean reversion expectations are built into the pricing of VIX futures.

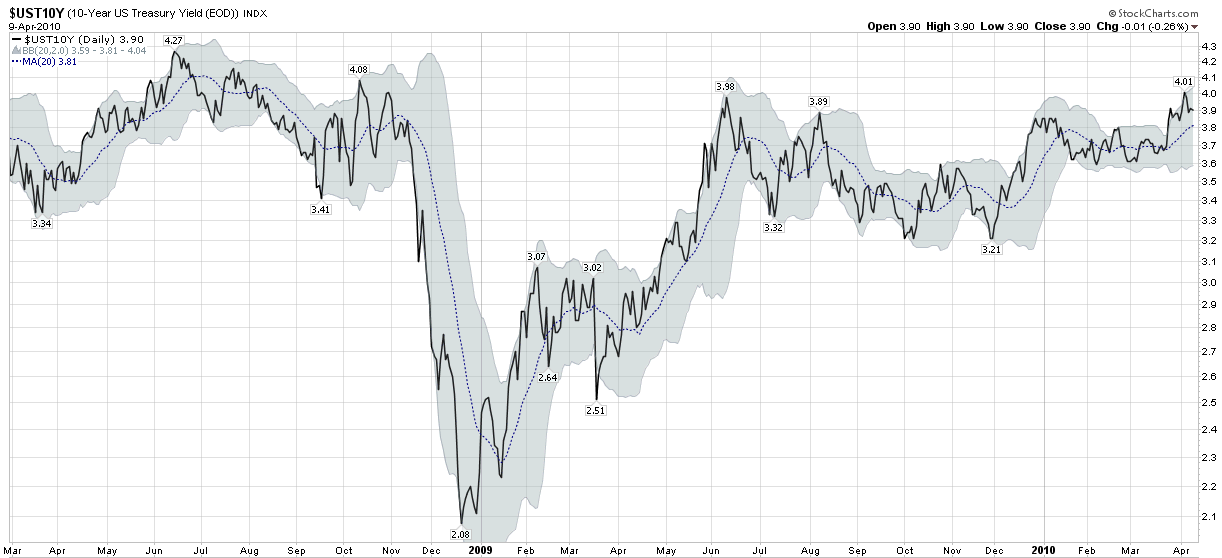
Ultimately the numbers will take back seat to the fundamentals of the European debt crisis, where there has been more evidence of contagion in Portugal, Spain and even Italy where yields on sovereign debt have increased dramatically in the past few days.

The SPX fell 6.5% during the relatively short-lived Dubai debt crisis of October-November 2009. The likelihood that the current European debt crisis will be resolved as quickly and smoothly as the Dubai situation strikes me as remote, which is why I will be looking to take profits on short volatility positions quickly.

For more on related subjects, readers are encouraged to check out:


Disclosure(s): Short VIX and VXX at time of writing

Tuesday, April 27, 2010

Short-Term and Long-Term Implications of the 30% VIX Spike

Today the VIX spiked 30.6% and closed over 22.00 (22.81) for the first time since the middle of February. While 22.81 is not the kind of number that suggests panic is in the air, it should be noted that since the VIX was officially launched in 1993, the VIX has spiked 30% in one day on only seven prior occasions. Those prior spikes were in the throes of some volatility events that posed serious systemic threats – or what I call structural volatility. Prior 30% spikes occurred at the height of the 2008 financial crisis (twice), during the 1997 Asian financial crisis and in the wake of the 9/11 World Trade Center attacks in 2001. In this context, the current threat to Europe in the form of deficit problems in Greece, Portugal and the rest of the PIIGS strikes me as a less significant structural risk, at least for now.

Readers who have followed this blog for a long time will know that I am a proponent of fading most volatility spikes with short volatility positions such as short VIX options (e.g., calls and call spreads), short VIX futures, short VXX, short various index/ETF strangles and straddles, etc. In the 38 times the VIX has spiked at least 20% in a single session since 1990, the volatility index has been, on average, down 7% three days later and down 9% five days later. Approximately 75% of the time the VIX is down three and five days following a 20% one day spike. Even during the last three months of 2008, when the risk to the financial system was the highest it has ever been and stocks were on a steep downward trajectory, going long SPX/SPY on a 30% VIX spike was profitable for the 3-5 day holding period.

Fading VIX spikes over a longer holding period is a little more problematic. Set aside the 2008 data and the long-term results of fading a VIX spike are extremely promising. Include the 2008 data, however, and the fat tails make a longer-term holding period into the teeth of a crisis an unprofitable venture. The bottom line is that whether this is a quick storm or the beginning of a major crisis, a 3-5 day holding period should provide a statistical edge. Of course, if you can be certain that a major crisis will not develop, then a longer-term holding period will generate larger profits.

For those trying to put the fundamentals of the European debt situation and volatility risk into perspective, some time with A Conceptual Framework for Volatility Events and Forces Acting on the VIX may be helpful. Readers who are more interested in the numerical context of history may wish to study Elast-o-VIX and VIX Spike of 35% in Four Days Is Short-Term Buy Signal from the list below.

For more on related subjects, readers are encouraged to check out:

Disclosure(s): Short VIX and VXX at time of writing

Sunday, April 25, 2010

Chart of the Week: New 52-Week Highs

There has been a good deal of debate in the investment community lately about whether equities are currently overbought. As a look at charts of individual equities I am struck by the number of stocks that are now making fresh 52-week highs.

This week’s chart of the week below chronicles one year of 52-week highs in the NYSE. Using new highs as an indicator of internal market strength, it is easy to see how momentum has continued to build over the course of the last year, with so many stocks hitting new highs last Friday (614 on the NYSE) that breakouts to new highs have created their own self-sustaining demand.

It only takes a couple of negative days to turn the new high trend in the other direction, but I have always been reluctant to short stocks that are making new highs. Even at historically elevated levels, an increasing number of new highs is a sign of strong market breadth and a healthy, broadly diversified rally.

For more on related subjects, readers are encouraged to check out:


[source: StockCharts.com]

Edit: Steve Place had an excellent suggestion that I try an arithmetically scaled (proportionally spaced) chart for these data sets. I have added a second chart with that arithmetically scaled Y-axis here.

Disclosure(s): none

Friday, April 23, 2010

Content Update

Lately this blog has been unusually quiet, but there is still a lot going on with VIX and More in other locations, with blog content soon to ramp up again to almost daily postings starting next week.

First, for those who may have missed it, Michael Stokes at MarketSci recently ran a three-part series on the VIX and More Stock of the Week ‘Sequential Portfolio,’ which is part of my weekly subscriber newsletter. I posted about the MarketSci review of the SOTW in MarketSci on the Stock of the Week ‘Sequential Portfolio,’ but did not mention two follow-up articles about the SOTW that completed the MarketSci series. The full series is as follows:

Before I leave the SOTW, I should note that this week’s selection, Xyratex (XRTX) had a very solid week, recovering from a down day on Monday to post a 10.7% gain for the week. This brings the cumulative performance of the SOTW to +1145% since the March 30, 2008 inception.

In related news, I recently posted my quarterly update to the VIX and More Subscriber Newsletter Blog to summarize enhancements made to the subscriber newsletter during the first quarter and to discuss the results of three model portfolios I maintain, in addition to the SOTW. The news is all positive and is detailed in Newsletter and Portfolio Performance Update for 3/31/10.

I have also posted a quarterly update to the VIX and More EVALS Blog. EVALS is short for ETF Volatility Analysis Long/Short and reflects an approach to trading ETFs that relies primarily on volatility-based signals. For more information, try EVALS Q1 2010 Update.

Last but not least, Monday marked the publication of the second issue of Expiring Monthly: The Option Traders Journal. This electronic magazine has generated a fair amount of buzz and very positive feedback. I have attached a graphic of the Table of Contents for the April issue below. For the April edition, I contributed an article on selling vertical spreads as well as an ongoing graphical look at the options world we call Charting the Market. More information is available at http://www.expiringmonthly.com/.

As an aside, while I still consider myself to be a full-time trader, in my not-so-abundant ‘free’ time I am also rewriting portions of Trading with the VIX: How to Use Fear, Volatility and Sentiment to Enhance Trading. The folks at Wiley have been very patient with this process, but the time has come to step up my efforts to complete the manuscript. I will do my best to keep the new content flowing at VIX and More, hopefully on an almost daily basis, but the book deserves – and will receive – the bulk of my prose attention going forward.

For more on related subjects, readers are encouraged to check out:


[source: Expiring Monthly]

Disclosure(s): I am one of the founders and owners of Expiring Monthly

Sunday, April 18, 2010

Chart of the Week: Goldman Sachs

There is no reason to get fancy with this week’s chart of the week. The big story of the week was accusations of fraud at Goldman Sachs (GS), with the SEC claiming Goldman misrepresented the selection process for some collateralized debt obligations (CDOs) resulting in a fraud worth $1 billion.

The chart below captures six months of price action in GS and shows how Friday’s selloff erased most of the gains in the stock from the last three months. Of particular interest is the spike in both historical volatility (HV20) and implied volatility (IV30), with historical volatility now higher than its forward-looking implied volatility counterpart. With elevated volatility, options traders are loving GS for now, whether they have thoughts about the future direction of GS stock or are just looking to sell options to capture the extra premium.

Note that Goldman is scheduled to report earnings before the market opens on Tuesday.

For more on related subjects, readers are encouraged to check out:


[source: Livevol Pro]

Disclosure(s): Livevol is an advertiser on VIX and More

Wednesday, April 14, 2010

MarketSci on the Stock of the Week ‘Sequential Portfolio’

In case anyone missed it, I thought I should highlight an excellent discussion of the Stock of the Week ‘Sequential Portfolio’ by Michael Stokes at MarketSci. In my opinion, Michael’s blog is required reading for anyone who is interested in a technical discussion of trading systems and approaches to developing trading strategies. Frankly, I was delighted that he decided to put the Stock of the Week (SOTW) through the paces.

MarketSci’s Review of the VIX & More Stock of the Week examines performance based on a buy at the open at the beginning of each week and a sell at the close each Friday. This is different from the Friday close to Friday close data I have always reported in my subscriber newsletter, because I always wanted to report a cost basis in the newsletter on Sunday and assumed that if I avoided stocks which had news over the weekend, the difference between using a Friday close vs. a Monday open as a cost basis would not be meaningful in the long run.

For the first year or so, the difference between Friday’s close and Monday’s open was not meaningful. During the rally from the March 2009 bottom, however, a good portion of the gains for stocks have come on Mondays. Earlier this week, Business Week cited data from Bespoke Investment Group which attributes all of the gains in stocks over the course of the past six months to Mondays, with 80% of all Mondays being up days during this period.

In addition to the rise of ‘Magic Mondays,’ the SOTW also was prescient enough to flag Bell Microproducts (BELM) as a SOTW selection the day before Avnet (AVT) agreed to acquire the company for a 29.2% premium over Friday’s closing price two weeks ago. Unfortunately, the acquisition was announced before BELM opened for trading on Monday. After some deliberation, I included the acquisition-related gains in the performance data rather than rewrite the rules for tracking the performance of this portfolio after nine quarters of adhering to one set of standard practices.

By all means, click through and see what MarketSci has to say about the Stock of the Week. By his calculations, a Monday to Friday holding period has yielded a 103.9% annualized return during a period in which the S&P 500 index has lost money. While a one stock ‘portfolio’ can hardly be considered anything less than high risk, I was also pleased to see the stellar 1.83 Sharpe ratio, which is a standard measure of risk-adjusted performance.

For the record, this week’s SOTW selection, UFS, is up 4.3% for the first three trading days of the week. Last week, IPSU delivered an 8.7% return for the week. (Both calculations utilize Friday’s closing price as the cost basis.)

For more on related subjects, readers are encouraged to check out:

…or pay a visit to the VIX and More Subscriber Newsletter Blog and the most recent post, Newsletter and Portfolio Performance Update for 3/31/10.

Disclosure(s): long UFS and IPSU at time of writing

Tuesday, April 13, 2010

Technical Resistance Looms in S&P 500 Index

With a strong earnings report coming from Intel (INTC) after hours, the futures are pointing to a bullish open tomorrow morning and a likely run at 1200 for the S&P 500 index.

Now that quite a few pundits already on record as saying that stocks are overextended, this seems like a good time to play the Fibonacci retracement card and suggest that significant technical resistance looms for the SPX, particularly in the area of 1225 and above.

As the chart below (three years, weekly bars) shows, SPX 1225 is technically significant for several reasons. First of all, 1228 is the 61.8% retracement level from the October 2007 high to the March 2009 low. Second, the SPX 1225-1250 zone sits just below where the index closed (1251) on the Friday prior to the Lehman Brothers bankruptcy filing. Looking farther back, the 1225-1250 zone also defines support for the March 2008 (Bear Stearns) low and subsequent lows in the beginning of July 2008.

To quickly summarize, the SPX first has to scale the psychologically significant 1200 level, where the last close above the level was on September 26, 2008. On the other side of 1200 looms a key Fibonacci retracement level, as well as the ghosts of Lehman Brothers, Bear Stearns and others.

Now it is possible that stocks will continue to ignore gravity and skate right past these barriers, but I suspect it is finally time that technical resistance decides to drop its gloves and fight back.

For more on related subjects, readers are encouraged to check out:


[source: StockCharts.com]

Disclosure(s): none

Sunday, April 11, 2010

Chart of the Week: 10-Year Treasury Note Yield

I’ll be the first to admit that I have never considered myself a ‘bond guy’ and I spend much less time than I probably should studying the bond market. That being said, I know I have quite a few equity-centric readers who think the bond market moves too slowly to warrant their attention. The attitude is frequently, “I’ll never be a bond trader, so why should I spend my time watching bonds?”

My quick answer to bond skeptics is that bonds can help to divine the direction of interest rates and bonds frequently make major market turns before stocks do. Additionally, with the advent of bond ETFs such as the highly liquid TLT (and its +3x and -3x counterparts, TMF and TMV), it is now much easier for the retail investor to trade the U.S. Treasury long bond and their volatile triple ETF counterparts, as well as some of the shorter-dated Treasury ETFs, such as IEF, which is comprised of U.S. Treasury Notes with a target maturity of 7-10 years.

The bond world is so large that I have singled out one particular bond in this week’s chart of the week as the bond number for non-bond people to follow. The chart is the yield on the 10-Year U.S. Treasury Note, which is the de facto benchmark for government and sometimes even for corporate bonds as well.

Note that the yield on the 10-Year Treasury Note just hit 4.00 last week, attracting buyers such as BlackRock (BLK), which found the steep yield curve a good reason to buy some of the 10-Year Treasury Notes.

For those who wish to dive further into the subject of intermarket relationships such as the link between bonds and stocks, an excellent place to start is with John Murphy’s Intermarket Analysis.

For more on related subjects, readers are encouraged to check out:


[source: StockCharts.com]

Disclosure(s): short TLT at time of writing

Sunday, April 4, 2010

Chart of the Week: CBOE Monthly Equity Put to Call Ratio Nears All-Time Low

For trading purposes, I adhere fairly faithfully to a 10-day exponential moving average (EMA) of the CBOE equity put to call ratio (CPCE) as an appropriate smoothing factor to flag short to intermediate-term swing trading opportunities. There are occasions, however, when a longer-term moving average, like a 21-day simple moving average, is a better tool for identifying persistent extremes in put and call activity. This week is one of those occasions.

The chart of the week below looks at the full history of the CBOE equity put to call ratio, which dates from October 21, 2003, and applies a 21-day SMA (dotted blue line) to generate what I call the monthly equity put to call ratio. As the chart shows, readings below 0.60 have generally been a good time to take profits on long positions and/or initiate short positions. In fact, the current 0.53 level has only been seen on one prior instance, in January 2004. That period just happened to be exactly 13 months after the S&P 500 index had bottomed and started a strong bull rally. It also marked the beginning of a period in which stocks declined for ten months, before resuming a rally that would ultimately last until October 2007.

Of course there is nothing magical about low equity put to call ratios or rallies stalling after a 13 month rise, but bulls and bears alike should certainly take note of historical precedent.

For more on related subjects, readers are encouraged to check out:


[source: StockCharts.com]

Disclosure(s): none

Thursday, April 1, 2010

Some More High Short Interest Stocks

Yesterday’s Short Squeeze Portfolio One Year Later highlighted seven stocks and two ETFs which had extremely high short interest back in early March 2009. Not surprisingly, these stocks have done very well as the market and the economy have turned around.

After having the bulls in chart for some 13 months, is a similarly constructed portfolio using current data a shopping list for bulls or for bears?

Looking at the list below (which includes companies with 30% of the float short, average volumes of at least one million shares per day, as well as additional filters for optionability, minimum market cap, price, etc.), which I assembled after yesterday's close, there is a strong representation of recent high fliers (TLB, SKS) in addition to several stocks that have been underperforming as of late (GDP, STEC, FSYS). Given my bias for shorting weakness rather than strength, I will be looking most closely at the latter group as possible short candidates, while keeping an eye on retailers such as Talbots and Saks as possible buy on the dip candidates until there is better evidence that the consumer – and retail stocks – are suffering from fatigue.

For more on related subjects, readers are encouraged to check out:


[source: FINVIZ.com]

Disclosure(s): none

DISCLAIMER: "VIX®" is a trademark of Chicago Board Options Exchange, Incorporated. Chicago Board Options Exchange, Incorporated is not affiliated with this website or this website's owner's or operators. CBOE assumes no responsibility for the accuracy or completeness or any other aspect of any content posted on this website by its operator or any third party. All content on this site is provided for informational and entertainment purposes only and is not intended as advice to buy or sell any securities. Stocks are difficult to trade; options are even harder. When it comes to VIX derivatives, don't fall into the trap of thinking that just because you can ride a horse, you can ride an alligator. Please do your own homework and accept full responsibility for any investment decisions you make. No content on this site can be used for commercial purposes without the prior written permission of the author. Copyright © 2007-2023 Bill Luby. All rights reserved.
 
Web Analytics